
Published May 3, 2026
List to Sale Price Ratio in Salem, Oregon (March 2026): What Every Seller Needs to Know Before Pricing

List to Sale Price Ratio Salem Oregon 2026: What 98.23% Means Before You Price Your Home
Salem Oregon's list-to-sale price ratio came in at 98.23% in March 2026 — meaning homes are selling for just under their asking price, on average. That's a slight dip from March 2025's 99.20%, and it carries a clear message for sellers: the market is still strong, but how you price your home now matters more than it did a year ago. Get it right, and you can still walk away very close to asking. Get it wrong, and buyers will make you feel it.
What Is List-to-Sale Price Ratio and Why Should Salem Sellers Care?
The list-to-sale price ratio compares the final sale price of a home to its original asking price, expressed as a percentage. A ratio of 100% means a home sold exactly at list price. Below 100% means it sold for less; above 100% means buyers bid it up. In a healthy but competitive market like Salem's, this number tells you more about real buyer behavior than any headline statistic.
Think of it as the market's report card on seller pricing decisions. When you see 98.23% across all areas and property types in Salem, it tells you two things simultaneously: buyers are engaged and willing to transact near asking price, but they are not — as a rule — offering above list the way they were during the frenzy of 2021 and 2022. That nuance is everything when you're sitting down to choose your list price.
For sellers worried about leaving money on the table, this number is actually reassuring. It means the market is rewarding well-priced homes. But it also means overpriced listings face a harsher reckoning. Buyers in 2026 are informed, patient, and have more options than they did two or three years ago. They will wait you out — and then make a lower offer when you finally reduce.
How Does the March 2026 Ratio Compare to March 2025?
In March 2025, the Salem market posted a list-to-sale price ratio of 99.20%. One year later, that figure sits at 98.23% — a drop of just under one full percentage point. On a $450,000 home, that difference translates to roughly $4,365. Not catastrophic, but directionally meaningful: the market has softened slightly, and sellers can no longer rely on buyer enthusiasm to paper over a pricing mistake.
To put this in broader context, we're not talking about a market in retreat. A 98.23% ratio is still a seller-friendly number by historical standards. Pre-pandemic Salem markets regularly saw ratios in the 96–97% range. What's changed is the margin for error. In 2021, an overpriced home might still attract offers because demand was so compressed. In 2026, that same overpriced home sits. Days on market accumulate. The listing goes stale. And when the price reduction finally comes, buyers wonder what's wrong with the property — even if the answer is simply "the seller started too high."
The year-over-year softening is not a crisis. It's a calibration. And for sellers who price precisely, it changes very little about their outcome.
See how Salem's 161% home price growth since 2012 still gives today's sellers significant leverage
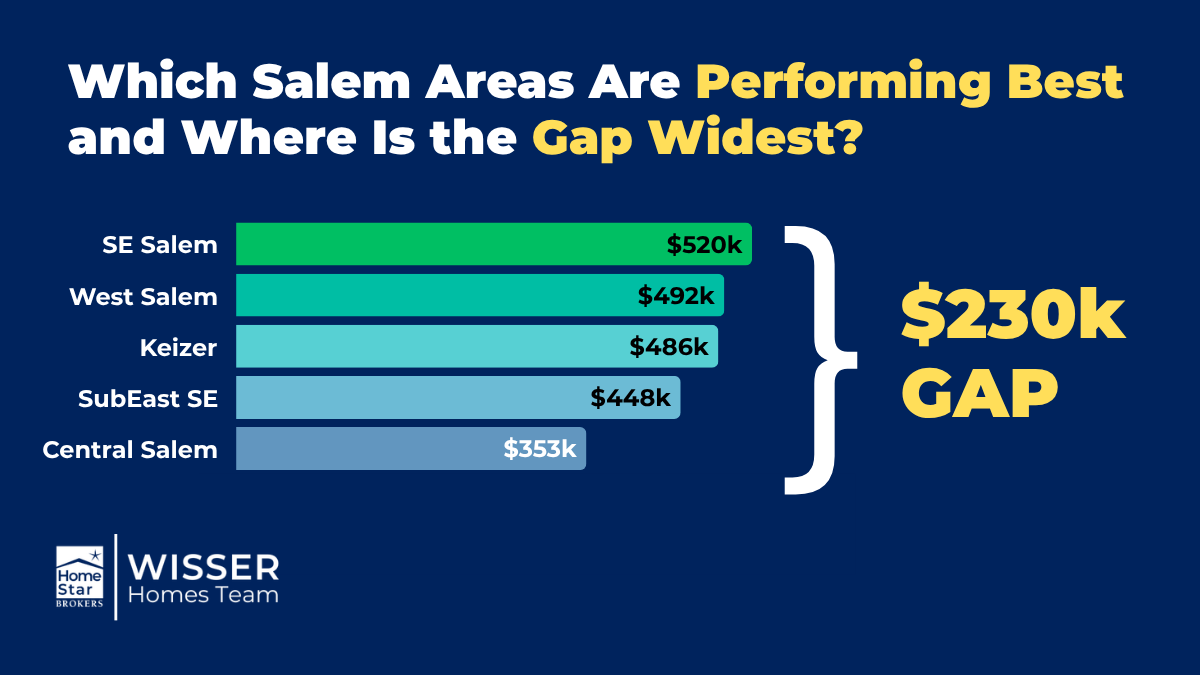
Which Salem Areas Are Performing Best — and Where Is the Gap Widest?
Not all Salem neighborhoods are behaving the same way in March 2026. Area 30 — the Suburban Northeast corridor — hit exactly 100% sale-to-list, meaning homes there sold at full asking price on average. Area 50, South Salem, came in at the low end at 97.7%. The gap between these two areas is more than two percentage points — which, on a $500,000 home, is a $11,500 difference in what sellers actually net.
Area 30 — Suburban Northeast Salem: The Standout Performer
With a 100% sale-to-list ratio, Northeast Salem's suburban corridors are doing something no other area in the market is: homes here are selling at exactly what sellers ask. This reflects strong demand from buyers who value proximity to the Silverton Road corridor, easy access to I-5, and the family-friendly neighborhoods that define this quadrant. If you own a home in Area 30, you have pricing leverage right now.
Area 50 — South Salem: The Most Price-Sensitive Market
South Salem's 97.7% ratio is the lowest in the market — and it deserves a candid explanation. South Salem carries some of Salem's highest price points, and higher-priced homes across Oregon tend to see wider list-to-sale gaps simply because the buyer pool is smaller and more selective. Buyers at $550,000, $650,000, and above have more time, more options, and more leverage to negotiate. That doesn't mean South Salem is a bad market — it means precision pricing is non-negotiable there.
If you're selling in South Salem, we'd point you to our detailed look at how South Salem compares to West Salem on price, schools, and resale dynamics — it gives important context for positioning your home correctly against the competition.
What the Area Breakdown Tells Us Collectively
The spread from 97.7% (Area 50) to 100% (Area 30) tells a nuanced story: Salem is not one monolithic market. It's a collection of neighborhood-level markets, each with its own supply, demand, buyer profile, and price sensitivity. A one-size-fits-all pricing strategy that ignores these micro-market dynamics will cost sellers real money. This is exactly why hyper-local data matters more than county-wide averages.
- Area 30 (Suburban NE): 100.0% — Full asking price achieved on average
- Salem overall: 98.23% — Competitive but buyer-aware
- Area 50 (South Salem): 97.7% — Most price-sensitive; precision required
Why Overpriced Homes Are Getting Hit Harder in 2026
The single biggest risk for Salem sellers in 2026 is not pricing too low — it's pricing too high and then chasing the market down. When a home sits on the market past the critical first-two-week window, buyers assume something is wrong. They discount their offers accordingly. By the time a price reduction attracts a new offer, the seller has often netted less than they would have with a sharp, well-researched list price from day one.
Here's the math that makes this concrete. Imagine a home that should be priced at $475,000. The seller lists at $499,000 hoping to leave room to negotiate. After 30 days and no offers, they reduce to $479,000. They eventually accept $465,000 — a 93.2% ratio and a result that's nearly $10,000 worse than if they'd priced accurately and sold in week two at $474,000 (99.8% of a smart list price).
We see this pattern regularly. And it's not about the market being weak — it's about buyer psychology. Stale listings carry a stigma. The longer the days-on-market number climbs, the more buyers wonder what the inspection will uncover, what the neighbors are like, what the seller is hiding. Right-priced homes don't give buyers time to second-guess.
This is especially true in South Salem, where buyers at higher price points are doing detailed comparables research of their own. Sophisticated buyers are not going to overpay for a home in a 97.7% market just because the seller started high.
What Does a 98.23% List-to-Sale Ratio Mean for Your Net Proceeds?
On a practical level, a 98.23% list-to-sale ratio means that for every $100,000 of list price, Salem sellers are netting about $98,230 at closing — before agent commissions, closing costs, and any seller concessions. On a $450,000 list price, that's an average sale price of $441,935. Understanding this helps you back-calculate the list price you need to hit your target net — which is a more useful exercise than guessing at a round number.
Here's how to think about it from a net-proceeds standpoint:
- List at $450,000 → Estimated sale at 98.23% → $441,935
- List at $475,000 → Estimated sale at 98.23% → $466,593
- List at $500,000 → Estimated sale at 98.23% → $491,150
But these are market averages — and averages hide the variance. A well-prepared home, priced correctly for its micro-market, can absolutely achieve 99–100% of list. An overpriced home in a price-sensitive area can easily land at 95% or below once the dust settles. The ratio is not destiny. It's a baseline. Your agent's pricing strategy and your home's presentation determine which side of that baseline you land on.
How the Wisser Homes Team Prices Homes to Perform, Not Just to List
Our pricing process at Wisser Homes is built around one goal: maximizing your net proceeds while selling in a timeline that works for your life. We don't pad list prices to win listings, and we don't underprice homes to guarantee a quick sale. We run a rigorous comparative market analysis that accounts for your specific area, your home's condition, recent sale velocity, and the current buyer pool — and then we give you a number we can defend.
Here's what our pricing process actually looks like:
- Hyper-local comparable analysis. We look at what's sold in your specific neighborhood — not just the zip code — in the last 60–90 days. We adjust for square footage, age, condition, lot size, and any upgrades. Salem's area-level variance (remember: Area 30 at 100% vs. Area 50 at 97.7%) means that using county-wide data to price your home is like using the state average temperature to decide what to wear today.
- Active competition review. We look at what's currently listed and how long those homes have been sitting. This tells us where buyer attention is already flowing and where price gaps exist that we can exploit in your favor.
- Absorption rate check. How many homes in your price range and area are going under contract each month? This tells us whether the market can absorb your listing quickly or whether you'll need to be more competitive to stand out.
- Condition and presentation premium. A home that's cleaned, decluttered, professionally photographed, and staged — even lightly — captures buyer attention faster and commands higher offers. We factor your home's presentation into our price recommendation, and we'll tell you honestly if there's low-cost prep work that would meaningfully change your list price.
- Strategic list price anchoring. We price with intent. Sometimes that means a round number for search filter optimization. Sometimes it means pricing just below a key threshold ($499,000 vs. $500,000) to capture more buyer searches. These small decisions can meaningfully affect your offer volume in the first two weeks.
The result is a list price that generates activity, not just impressions. And in a 98.23% market, generating real, competitive offer activity in the first two weeks is the single most important thing we can do for your bottom line.
Should Salem Sellers Worry About the Market Softening?
The honest answer is no — but sellers should respect the shift. A move from 99.20% to 98.23% year-over-year is not a market in trouble; it's a market finding equilibrium after several years of exceptional seller conditions. Salem's fundamentals remain strong: the Willamette Valley continues to attract relocating buyers from the Portland metro, inventory is not dramatically elevated, and interest rates — while above pandemic-era lows — have stabilized enough for buyers to plan.
What sellers should worry about is complacency. The sellers who will leave money on the table in 2026 are not the ones who price accurately — they're the ones who assume the market will forgive an aggressive list price the way it might have in 2021. It won't. Buyers have options. Buyers have data. And buyers in Salem are increasingly sophisticated about what comparable sales support.
The good news: if you price correctly, prepare your home thoughtfully, and market it aggressively in the first two weeks, you will still sell very close to asking. That's what 98.23% tells you. The market is not broken — it just requires intention.
Ready to Price Your Salem Home to Perform — Not Just to List?
Gavin and Julie Wisser specialize in data-driven pricing strategy for Salem and Willamette Valley sellers. We run a detailed, neighborhood-specific analysis — not a generic Zestimate — and give you a list price backed by real market evidence. Whether you're in South Salem, the Northeast suburbs, or anywhere in between, we'll help you maximize your net proceeds without leaving days on market on the table.
Contact the Wisser Homes TeamFrequently Asked Questions
What does a 98.23% list-to-sale price ratio mean for Salem sellers in 2026?
It means Salem homes are selling for about 98 cents on every dollar of list price, on average, in March 2026. For a home listed at $450,000, that translates to a typical sale price around $441,900. It's a strong market — but it rewards accurate pricing. Overpriced homes are landing further below asking, while right-priced homes are consistently hitting 99–100% of list price.
How does the Salem list-to-sale ratio in 2026 compare to last year?
In March 2025, Salem's list-to-sale price ratio was 99.20%. By March 2026, it had softened to 98.23% — a drop of about one percentage point. This reflects a modest cooling in buyer competition. The market is still seller-friendly by historical standards, but buyers have more negotiating room than they did a year ago, especially for homes that are overpriced or need significant work.
Which Salem neighborhoods have the highest list-to-sale price ratios right now?
As of March 2026, Area 30 — Suburban Northeast Salem — leads the market with a 100% sale-to-list ratio, meaning homes there sold at exactly asking price on average. South Salem (Area 50) is currently the most price-sensitive area at 97.7%. If you're selling in Northeast Salem, you have strong pricing leverage. If you're in South Salem, precision pricing and excellent home preparation are non-negotiable.
Will pricing my home too high hurt my final sale price in Salem?
Yes — and often significantly. Overpriced homes accumulate days on market, which triggers buyer skepticism. By the time a price reduction brings in an offer, the seller typically nets less than they would have with a well-researched list price from day one. In Salem's current market, the first two weeks on market are critical. A right-priced home attracts immediate activity; an overpriced one waits — and waiting costs money.
How do I find out what my Salem home should be listed for in 2026?
The most reliable approach is a comparative market analysis (CMA) from a local agent who knows your specific neighborhood — not just the zip code. County-wide or city-wide averages can mislead because Salem's micro-markets vary significantly. The Wisser Homes Team provides detailed, neighborhood-specific CMAs for Salem and Willamette Valley sellers that factor in recent sales, active competition, absorption rates, and your home's condition. Reach out at wisser.homes/contact to get started.